Explain the city | |GDP, GNP, GPI, EF, which index is more scientific?
[Editor’s Note]
In the previous column, the author introduced some basic laws in the field of urbanism. From this issue, the column "Explaining Cities" will focus on some important variables in cities, and interpret the general characteristics and laws of urban development through these variables.
In this issue, the article will focus on the regional GDP and see the similarities and differences between "big city" and "strong city" through the regional GDP.

However, the GDP theory has long been abandoned in the assessment of officials.
However, at the end of the year and the beginning of the year, when the macroeconomic forecast for the next year is released, GDP is still an important indicator that cannot be separated.
Then, besides GDP, what other indicators can measure the economic strength of a country or city?
I. GDP, GNP, GRP, GMP and GCP
Speaking of gross domestic product (GDP), I believe most people are no strangers.
Before World War II, countries generally used gross national product (GNP) to measure the intensity of economic activities of a country and region when studying national economic income and national economic growth.
In 1937, the then American economist simon Kuznets.(The winner of the 1971 Nobel Prize in Economics, also known as the father of GNP)In a report to the US Congress, it is proposed that a more improved method should be used to measure the final results of production activities of all permanent units in a country (or region) in a certain period of time. In 1953, the National Economic Accounting System (SNA) issued by the United Nations was established and widely adopted by all countries.
It was in 1991 that countries really compared GDP as a representative indicator of national strength and economic scale.
Over the years, the use of GDP to measure the economic scale and output of a country (or region) has been criticized. Some opponents believe that GDP ignores some non-market economic activities, GDP does not consider the consumption of resources and environment, and GDP does not represent residents’ income or wealth.
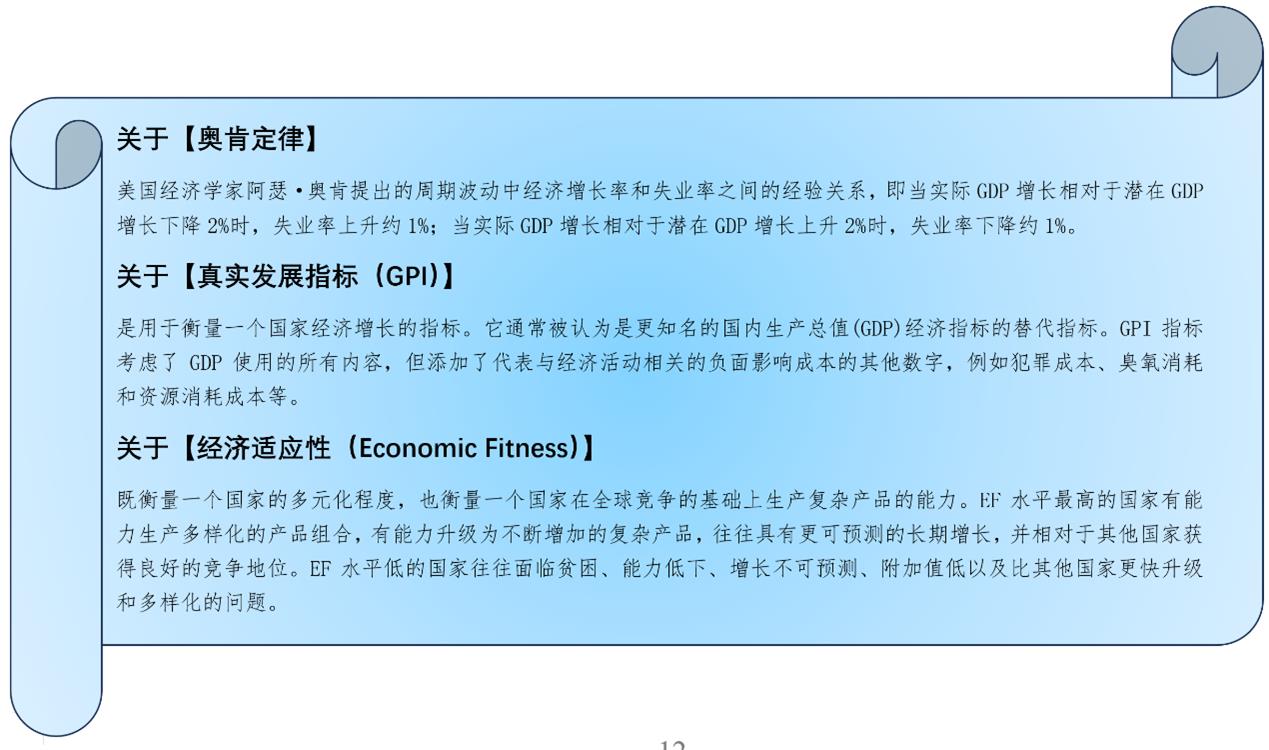
However, as a representative indicator of economic output and strength of a country or region, its status is still unshakable. The biggest advocate is the American economist Arthur Okun. He put forward the famous okun’s law, which, as an empirical rule, holds that the growth rate of actual GDP is faster than that of potential GDP.[Note: It is the economic growth rate that can be achieved when a country (or region) makes full use of various resources normally]Increase by 2% and the unemployment rate will drop by 1%. His law has been regarded as a standard by policy-making institutions in many countries. Reducing the unemployment rate by increasing the growth rate of real GDP is quite effective for a period of time.
Of course, there is also GDP at the city level, which is used to measure the final results of production activities of all permanent units in the city in a certain period of time. However, China’s official statistical agencies generally do not use the term urban GDP, but usually use "Gross Regional Product" (GRP) or regional GDP. The United States or Europe sometimes use the Gross Metropolitan Product (GMP) or the Gross City Product (GCP). Whether it is GRP, GMP or GCP, the meaning expressed is quite clear, that is, to measure the output scale of economic activities on a more microscopic geographical unit than a country (or region).
Second, look at big cities and strong cities from the regional GDP of China and the United States
In the last issue, the author introduced the differences between Chinese and American county economic and administrative systems. In terms of GDP statistics, China and the United States also have huge differences.
The administrative boundary of China is strictly consistent with the statistical boundary. For example, the statistical department of Shanghai is only responsible for the statistics within the administrative scope of Shanghai, and the calculated GDP is usually strictly within the administrative boundary of Shanghai.
However, the statistics in the United States are not. Administrative boundaries and statistical boundaries are two different things. The accounting of GDP at the city level in the United States is based on the Core-based statistical area. In short, first find a populated area, and then add the surrounding areas to form a statistical area. According to the population density, the United States is divided into 392 metropolises and 547 micropolitan.
However, there are 333 municipal administrative units in China, which are not the same as the names of metropolitan areas in the United States, and it is easy to form a greater illusion of metropolitan areas in the United States.
In fact, regardless of population or area, the municipal administrative units in China are generally larger than the metropolitan statistical areas in the United States, such as 70,000 square kilometers in the largest metropolitan area in the United States and 250,000 square kilometers in the largest city in China. The most populous metropolitan area in the United States has 20 million people, while China has 30 million people.
Despite this, the regional GDP at the city level of the two countries also shows some similar characteristics.
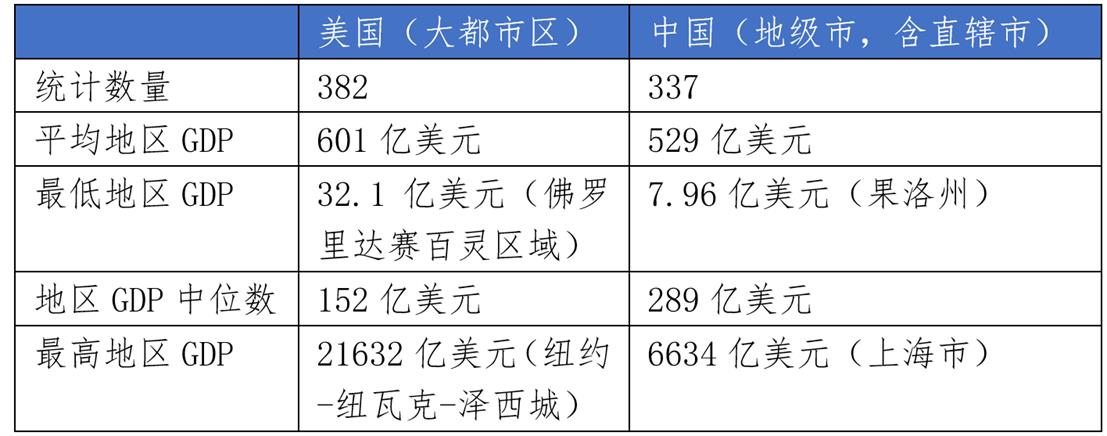
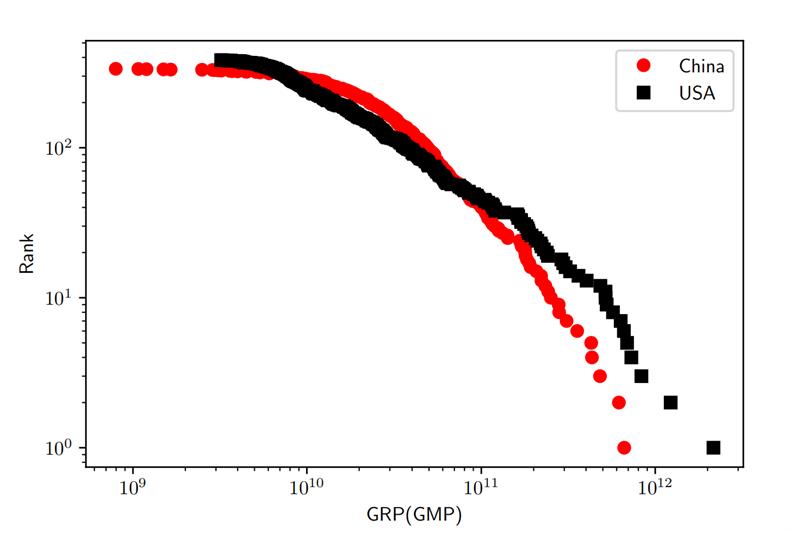
One is imbalance.The city with the highest GDP in China is Shanghai, which reached 4.47 trillion yuan in 2022, equivalent to more than 660 billion US dollars, more than 800 times that of the lowest prefecture-level region. New york-Newark-Jersey City, the largest metropolitan statistical area in the United States, has a GDP of $2,163.2 billion in 2022, more than 600 times that of the lowest metropolitan area in the United States. The development imbalance between cities in the two countries is more than 100 times, and the scale-sequence map at the regional level of the two countries also conveys the same trend.
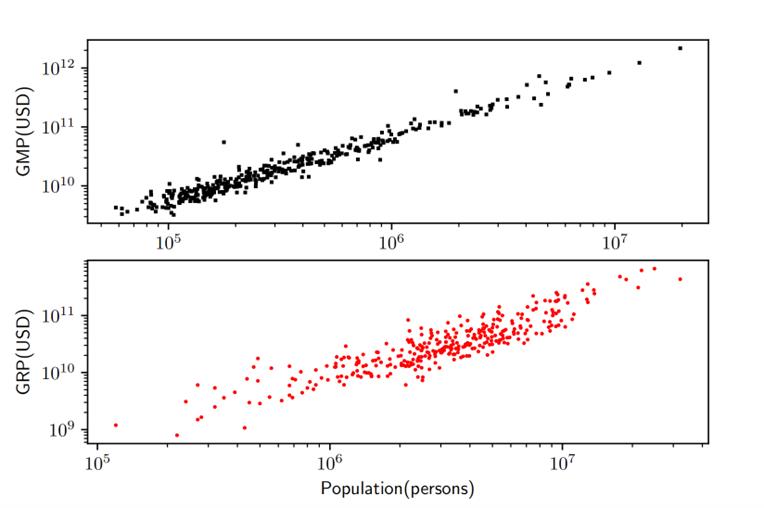
Second, it generally shows a superlinear relationship with the population.It is obvious from Figure 2 that there is a very consistent superlinear relationship between the regional GDP and the regional population in 2022. Through calculation, the allometric growth coefficients of both countries are 1.10. Especially, the logarithm of regional GDP and the logarithm of population in metropolitan areas of the United States are basically a straight line (the fitted R2 is as high as 0.96, and that of prefecture-level cities in China is as high as 0.81). This superlinear relationship also reveals the corresponding relationship between "big city" and "strong city" In the same economy, "big city" and "strong city" basically correspond. Every time the population size doubles, its GDP is expected to increase by 1.14 times (2 1.1-1 ≈ 1.14).
Table 1 Regional GDP statistics of metropolitan areas in the United States and prefecture-level cities in China in 2022


Figure 1 Relationship between GDP and ranking in the United States and China in 2022.

Figure 2 The superlinear relationship between GDP and population in China and the United States (the above picture shows the metropolitan statistical area in the United States, and the following picture shows the prefecture-level cities in China).
Third, are GPI and EF reliable?
GDP represents the economic output of a city, which, in addition to its own shortcomings, easily leads to the "GDP-only theory" of local governments.
In fact, at home and abroad once wanted to replace GDP with some indicators. Real progress indicator (GPI) is one of the important attempts. This indicator expands the traditional national economic accounting framework, including social, economic and environmental accounts (a little ESG! )。 GPI calculates the net value of the positive and negative results of economic growth to test whether economic growth benefits all people.
In recent years, the Economic Fitness (EF) launched by the World Bank has also been regarded by many scholars as an important measure of a country’s comprehensive strength, which has been widely concerned and studied. From GDP to GPI to EF, whether these indicators describing the comprehensive strength of the country can be applied to the urban system still needs further study and exploration.
In any case, regional GDP is still one of the most important indicators reflecting the comprehensive strength of cities.
—–
The column "Explain the City" is presided over by Dr. Dai Yuehua from Shanghai Institute of Development Strategy. It pays attention to the frontier trend of urban science development, explains the general characteristics and laws of urban science and human behavior dynamics in cities, and explores the ways and methods to optimize urban governance by using frontier urban science theory.