State Post Bureau: In February this year, 95% of consumer complaints involved express delivery services.
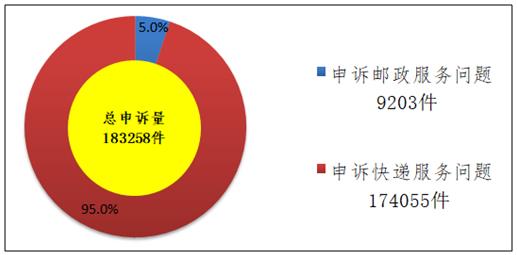
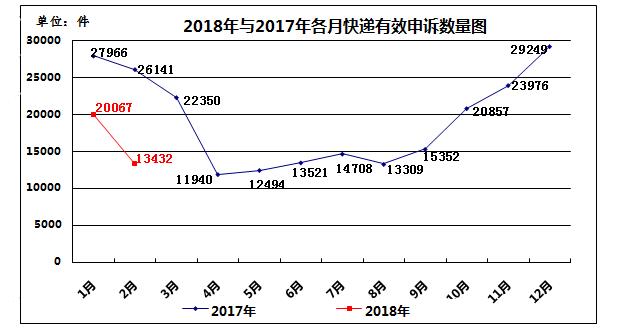
Cctv newsAccording to the website of the State Post Bureau, in February 2018, the State Post Bureau and the postal administrations of provinces (autonomous regions and municipalities) accepted a total of 183,258 consumer complaints through the "12305" postal industry consumer complaint telephone and complaint website. 9203 complaints involved postal services, accounting for 5.0% of the total complaints; There were 174,055 complaints about express delivery service, accounting for 95.0% of the total complaints.
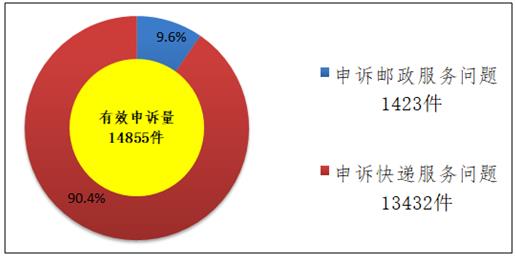
Among the accepted complaints, 14,855 were effective complaints (corporate responsibility was determined), a decrease of 50.1% over the same period of last year. There were 1423 effective complaints involving postal services, accounting for 9.6% of the effective complaints; There were 13,432 cases involving express delivery services, accounting for 90.4% of the effective complaints.
Consumers’ complaints were mediated according to the law and regulations, saving consumers 4.253 million yuan in economic losses. In February, 98.5% of consumers were satisfied with the handling of complaints by postal administrations, 98.4% with the handling of complaints by postal enterprises and 96.8% with the handling of complaints by express delivery enterprises.
In February 2018, there were 23 complaints that enterprises failed to reply within the prescribed time limit, a decrease of 40 compared with the same period last year.
name of the company
Jiangsu(Province)
Guangdong
Hainan
Gansu
Xinjiang
total
Pinjun express
2
eight
one
11
China Post
one
eight
nine
increase
one
one
other
one
one
2
total
2
three
eight
one
nine
23
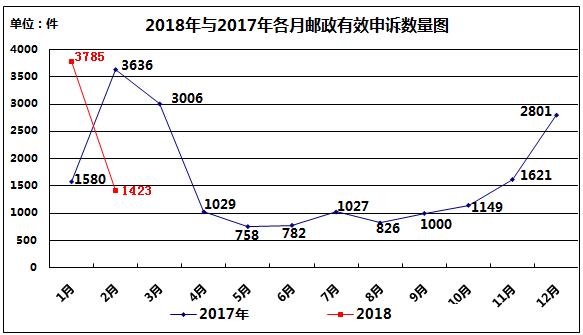
In February 2018, there were 1,423 effective complaints from consumers about postal services, a decrease of 62.4% from the previous month and a decrease of 60.9% from the same period last year.
serial number
Complaint problem
Number of complaints
Proportion%
The chain increased by%
Up% year-on-year
one
Delivery service
letters
450
508
35.7
-67.2
-45.6
Package
38
newspapers and periodicals
11
remit
seven
collect stamps
one
other
one
2
Shortage of mail loss
letters
366
413
29.0
-46.9
12.2
Package
forty-four
newspapers and periodicals
three
three
Mail delay
letters
357
411
28.9
-67.3
-80.5
Package
51
newspapers and periodicals
2
collect stamps
one
four
Mail damage
letters
53
63
4.4
-54.3
-47.9
Package
10
five
Receiving and sending service
letters
18
27
1.9
-56.5
-74.3
collect stamps
five
Package
four
six
Illegal charges
letters
one
0.1
-66.7
-50.0
total
— —
1423
100.0
-62.4
-60.9
In February 2018, the main problems of consumers’ complaints about postal services were delivery service, short mail loss and mail delay, accounting for 35.7%, 29.0% and 28.9% of the total complaints respectively.
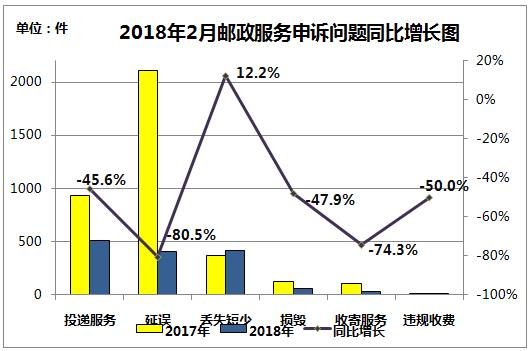
In February 2018, the main problems of consumers’ complaints about postal services showed a downward trend compared with last month. Compared with the same period of last year, consumers’ complaints about postal services only increased slightly.
(two) the provinces (autonomous regions and municipalities) effective complaints of universal postal service.
The average effective appeal rate of universal postal service in 31 provinces (autonomous regions and municipalities) was 9.24 per million, a decrease of 10.73 from the previous month. Among them, there are 10 higher than the average effective appeal rate, and the highest in China are Beijing and Xinjiang; There are 21 cases that are lower than the average effective appeal rate.
Table on Effective Complaints of Universal Postal Service in Provinces (autonomous regions and municipalities) in February 2018
Unit: Number of effective complaints/10 million pieces of import and export mail.
region
February 2018
Effective appeal rate
Main problems: effective appeal rate
Effective appeal rate in February 2017
compare to the same period of the previous year
delay
Loss and damage
Delivery service
Beijing
44.95
16.34
23.46
4.69
200.67
↓
Xinjiang
44.16
12.58
12.58
17.46
19.20
↑
Hebei
20.79
6.51
5.08
9.21
26.74
↓
Ningxia
17.97
3.59
0.00
14.38
17.75
↑
Hubei(Province)
14.46
5.40
2.89
6.17
10.88
↑
Guangdong
12.81
2.79
4.55
5.16
15.98
↓
Gansu
12.57
1.68
4.19
6.71
7.63
↑
Zhejiang(Province)
11.94
2.39
2.87
6.40
9.41
↑
Tianjin
11.87
2.60
1.11
8.16
93.97
↓
Guizhou (Province)
11.84
3.95
2.89
4.21
11.77
↑
Jiangxi
9.11
3.69
1.72
3.45
6.54
↑
Chongqing
6.76
1.50
1.13
4.13
18.59
↓
Heilongjiang Province
6.68
2.55
1.59
2.23
17.67
↓
Hunan
6.57
1.35
2.71
2.13
6.39
↑
Jiangsu(Province)
6.54
1.73
2.44
2.36
11.07
↓
Hainan
5.70
0.00
1.63
4.07
9.48
↓
Inner Mongolia
5.26
1.62
0.00
3.64
5.86
↓
Jilin (Province)
5.22
1.31
1.74
2.18
54.50
↓
Liaoning (Province)
3.73
0.62
0.83
2.07
18.67
↓
Xizang
3.58
0.00
2.68
0.89
1.06
↑
Shanghai
3.27
1.25
0.67
1.06
3.53
↓
Guangxi
2.97
0.37
1.85
0.37
7.34
↓
Yunnan(Province)
2.91
0.87
0.87
1.17
31.17
↓
Anhui (Province)
2.74
0.59
1.18
0.98
9.24
↓
Fujian(Province)
2.14
0.46
1.38
0.31
4.93
↓
Henan(Province)
1.82
0.61
1.01
0.20
28.03
↓
Shanxi(Province)
1.70
0.28
0.57
0.57
2.63
↓
Shandong(Province)
1.69
0.68
0.45
0.56
7.37
↓
Sichuan(Province)
1.32
0.26
0.66
0.39
3.95
↓
Shanxi
1.28
0.26
0.51
0.51
7.07
↓
Qinghai
1.21
0.00
1.21
0.00
2.62
↓
National average
9.24
2.67
3.09
3.30
22.20
↓
In February 2018, there were 13,432 effective complaints from consumers about express delivery services, down 33.1% from the previous month and 48.6% from the same period last year.
serial number
Complaint problem
Number of complaints
Proportion%
The chain increased by%
Up% year-on-year
one
Delivery service
4831
36.0
-31.5
-42.8
2
delay
4370
32.5
-19.3
-59.7
three
Missing shortage
2998
22.3
-47.5
-35.0
four
damage
789
5.9
-38.8
-46.1
five
Receiving and sending service
288
2.1
-27.8
-41.0
six
Illegal charges
sixty-nine
0.5
-29.6
-47.3
seven
collection on delivery
51
0.4
-7.3
-51.9
eight
other
36
0.3
-25.0
-29.4
nine
total
13432
100.0
-33.1
-48.6
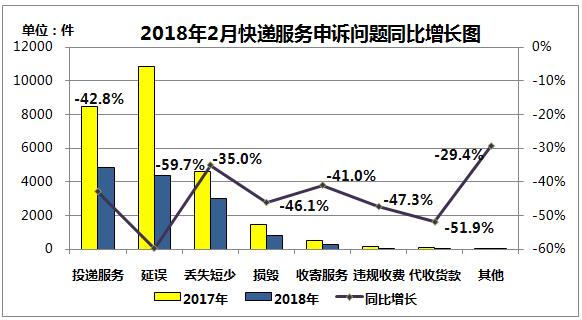
In February 2018, the main problems of consumers’ complaints about express delivery services showed a downward trend. Complaints are concentrated on delivery service, delay and loss, accounting for 36.0%, 32.5% and 22.3% respectively.
(2) Consumer complaints about express delivery companies
In February 2018, consumers made effective complaints against 43 express delivery companies. The effective complaint rate of express delivery services in the country was 6.75 parts per million, an increase of 1.72 month-on-month and a decrease of 4.40 year-on-year. There were 12 express delivery companies that were higher than the national average effective complaint rate. The effective appeal rate of express delivery service in China was 2.43 parts per million, a year-on-year decrease of 1.18; The effective complaint rate of express mail delay was 2.20 parts per million, a year-on-year decrease of 2.42. The effective complaint rate of lost and damaged express mail was 1.90 parts per million, a year-on-year decrease of 0.69.
Effective Appeal Rate Table of Major Express Companies in February 2018
Unit: Number of effective complaints/one million pieces of express mail
Enterprise name
Effective appeal rate in February 2018
Main problems: effective appeal rate
Effective appeal rate in February 2017
compare to the same period of the previous year
delay
Loss and damage
Delivery service
Zjs express
56.59
24.67
10.86
19.91
43.95
↑
Yousu
28.25
8.02
8.13
10.34
14.32
↑
guotong
27.94
10.25
9.70
7.20
27.61
↑
Quanfeng express
17.65
4.17
7.97
3.43
37.98
↓
Rufengda
15.75
6.42
2.04
7.00
40.27
↓
Postal express (EMS)
15.34
8.00
2.74
4.22
33.10
↓
every day
14.69
3.48
6.75
3.70
16.38
↓
yuantong express
13.47
3.21
4.05
5.96
11.64
↑
Sur
10.61
3.00
2.79
3.77
6.18
↑
Unitop express
9.09
2.10
0.00
5.59
5.10
↑
UPS
8.82
1.96
2.94
1.96
21.83
↓
STO.Express
7.90
1.57
2.19
3.80
22.71
↓
BEST Express
5.88
1.29
2.34
2.09
8.21
↓
Rapid express
4.86
1.72
1.73
1.17
3.66
↑
Deppon express
4.20
1.24
1.66
1.18
9.65
↓
Yunda Express
3.60
0.74
1.40
1.38
4.24
↓
TNT
3.47
0.00
1.73
1.73
5.17
↓
DHL
3.41
1.28
0.43
0.85
0.46
↑
ZTO Express
3.21
0.68
0.88
1.56
6.41
↓
Zhuoyue Amazon
2.23
0.00
0.00
2.23
7.68
↓
Di Sifang
1.94
0.22
1.20
0.37
1.39
↑
FedEx
1.89
0.00
0.00
0.94
1.70
↑
good name
0.87
0.33
0.22
0.22
3.46
↓
JD.com
0.55
0.23
0.02
0.30
0.86
↓
Suning.com
0.19
0.06
0.03
0.10
0.08
↑
Civil aviation express
0.00
0.00
0.00
0.00
6.71
↓
National average
6.75
2.20
1.90
2.43
11.15
↓
(three) the provinces (autonomous regions and municipalities) express service effective complaints.
The average effective appeal rate of express delivery services in 31 provinces (autonomous regions and municipalities) was 3.35 parts per million, an increase of 0.80 from the previous month. Among them, there are 16 higher than the average effective appeal rate, and the effective appeal rates of express delivery services in Xinjiang, Gansu and Hainan rank among the top three in the country; There are 15 cases that are lower than the average effective appeal rate.
Table on Effective Complaints of Express Service in Provinces (autonomous regions and municipalities) in February 2018
Unit: Number of effective complaints/one million (received and delivered) express mail.
region
Effective appeal rate in February 2018
Main problems: effective appeal rate
Effective appeal rate in February 2017
compare to the same period of the previous year
delay
Loss and damage
Delivery service
Xinjiang
32.25
14.10
8.95
8.87
17.41
↑
Gansu
7.73
2.29
2.00
3.29
6.26
↑
Hainan
6.46
2.10
1.46
2.45
6.55
↓
Qinghai
5.70
3.53
0.54
1.63
3.57
↑
Ningxia
5.40
1.52
1.39
2.36
3.54
↑
Hunan
5.00
3.04
0.92
0.90
4.87
↑
Heilongjiang Province
4.88
2.15
1.52
1.01
5.73
↓
Shanxi
4.66
1.62
one point three seven
1.54
7.16
↓
Jiangsu(Province)
4.65
1.72
1.16
1.62
5.97
↓
Beijing
4.54
1.12
1.89
1.41
11.52
↓
Xizang
4.44
0.00
2.22
1.11
8.91
↓
Guizhou (Province)
4.32
1.52
0.88
1.59
6.11
↓
Zhejiang(Province)
4.28
1.22
1.10
1.90
5.11
↓
Henan(Province)
3.96
1.63
0.86
1.29
4.23
↓
Inner Mongolia
3.80
2.15
0.68
0.83
8.06
↓
Chongqing
3.62
1.04
1.04
one point three seven
4.03
↓
Yunnan(Province)
3.30
1.01
0.93
1.12
6.40
↓
Shandong(Province)
3.28
0.97
0.94
1.23
6.38
↓
Hubei(Province)
3.15
1.49
0.61
0.94
4.60
↓
Jilin (Province)
3.02
1.22
0.97
0.84
8.91
↓
Anhui (Province)
3.02
1.53
0.69
0.76
4.04
↓
Tianjin
2.83
0.92
0.71
1.14
10.41
↓
Hebei
2.65
0.83
0.77
0.93
4.68
↓
Shanxi(Province)
2.60
1.05
0.83
0.66
3.39
↓
Jiangxi
2.55
1.15
0.57
0.77
6.42
↓
Guangxi
2.45
0.68
0.69
0.88
4.39
↓
Guangdong
2.40
0.47
0.79
1.04
3.68
↓
Fujian(Province)
2.34
0.60
0.58
1.07
5.53
↓
Shanghai
2.14
0.66
0.71
0.74
9.55
↓
Liaoning (Province)
1.64
0.67
0.46
0.47
6.94
↓
Sichuan(Province)
1.57
0.45
0.43
0.52
3.50
↓
National average
3.35
1.09
0.94
1.20
5.72
↓