In recent years, with the continuous promotion of ecological civilization construction, the concept of green environmental protection and low-carbon travel has gradually taken root in people’s hearts, thus driving the vigorous development of new energy automobile industry. According to public data, as of 2023, China’s new energy vehicle production and sales ranked first in the world for nine consecutive years, with a market share of 31.6%. In the process of the strong rise of new energy vehicles, Hongxida, the leader of high-end micro-cars, has a rapid growth momentum, and gradually realizes all-round high-quality development from products to brands, from categories to quality.
Hongxida explained to reporters how the micro-electric vehicle market is becoming bigger, stronger and better: from the demand side, on the one hand, with the continuous advancement of urban-rural integration, users’ micro-travel has undergone a "quantitative change", which is no longer limited to going out to buy food, picking up children, etc., but expanding in many directions such as Zhou Bianyou, shopping, and camping in the wild; On the other hand, with the continuous upgrading of consumption concept, users put forward new requirements of "qualitative change" for micro-travel vehicles, which are no longer satisfied with basic functions, but pay more attention to the appearance, safety and intelligence of products. From the supply side, based on the insight into users’ real needs, Hongxida actively develops high-end products that meet consumers’ expectations with scientific and technological innovation as the starting point, and realizes a complete market closed loop.

Innovative technical strength, adhere to the new bottom line of quality first
Since the establishment of the brand, Hongxida has always been focused on building a "four modernizations" micro-electric vehicle that is electric, personalized, intelligent and universal with the concept of automobile research and production. After years of exploration and efforts, Hongxida has successfully built the first world-class platform architecture for micro-electric vehicles. At the same time, relying on the technical advantages of Hi Tech, Hongxida independently developed high-efficiency lithium batteries, promoted the development process of lead and lithium at the same price, helped all models to carry high-quality lithium batteries, and achieved a major breakthrough in the electronic control technology of battery motors, which fundamentally guaranteed the safety attributes of products.
In addition, the main models of Hongxida are all "three-body" with full sheet metal, full sequence die and full load. In order to verify the "hard power" of the "three-car body", from November 2023 to March 2024, the brand planned the first "violence challenge" in the whole industry, which was carried out from four aspects: collision, compression resistance, roasting and rolling. The final product passed all the tests perfectly, which indicated that Hongxida had the absolute strength to lead the safety of micro-electric vehicles to a new level.
Recently, the conference on the completion of Hongxida (Jinzhai) digital industrial park and the listing of new cars came to a successful conclusion in Jinzhai County, Anhui Province. Under the joint witness of the leaders of the local county government, Binzhou City, Shandong Province and Wulian County, Shandong Province, the Jinzhai production base with a total investment of nearly 1.8 billion yuan and an area of about 323,600 square meters was officially completed. As a modern smart factory integrating R&D, production, warehousing and logistics, it has laid a solid foundation for improving productivity and achieving the annual output target of 500,000 vehicles per year.

Next, Jinzhai production base and Shandong Binzhou production base will jointly form the core productivity of Hongxida. With the strong support of Qingdao R&D Center, Hongxida has initially built a new development pattern of "one heart and two wings". This is of far-reaching strategic significance to promote the brand’s all-round efforts in the five dimensions of R&D and production, advanced technology, brand marketing, market expansion and channel construction, improve the quality threshold of the micro-electric vehicle industry, and empower the high-quality development of the high-end micro-electric vehicle industry.
High-end brand rejuvenation, leading the industry to upgrade the new engine
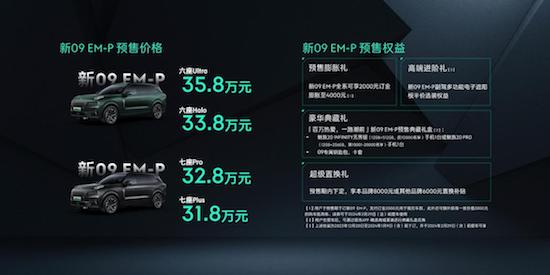
With the addition of new productive forces such as high-end, intelligent and green, Hongxida has the comprehensive strength to develop high-end micro-electric vehicles. Based on this, Hongxida puts forward a brand-new brand positioning of "the pioneer of high-end micro-cars", and implements comprehensive upgrading and reform from the aspects of brand, technology, products and services, so as to promote the continuous evolution of the brand in the direction of high-end. The most remarkable effect of this upgrade and reform is reflected in the fact that during the Jinzhai conference, Hongxida simultaneously launched three new flagship models, namely, ID7, H5 and X3.
Among them, ID7, which defines the new standard of high-end three-wheels, adopts the modeling design of the front face of the high-speed rail warhead and the fully wrapped hidden front wheel, taking into account the fashionable and dynamic appearance and the ability to reduce resistance. As the brand’s highest-standard four-wheeled product, the new flagship H5 of family mini-car closely guards the whole family’s travel with its 3-meter-long body and double-row four-seat leather seats. X3, a new species of fun travel, is the first to open up a new category of inverted tricycle, and "7500W high-power motor +225/50R14 ultra-wide tire" gives consideration to speed and safety.

In terms of categories, Hongxida products have completed the comprehensive coverage of three rounds, four rounds and three rounds, which can meet the diversified needs of the elderly, simple travel of small families and young people’s pursuit of individuality, and can effectively enhance the sense of happiness and acquisition of urban residents. From the configuration point of view, whether the ID7 comes with a 50L large-capacity trunk, the H5-equipped brake booster makes the braking more stable and faster, or the T-shaped ultra-stable chassis structure formed by the X3 under the McPherson front suspension and hydraulic rear shock absorber, it has shown the characteristics and advantages of new products, such as larger space, stronger practicability, more stable control, better safety, more functions and better comfort.
This time, Hongxida has achieved a major breakthrough in design concept, software and hardware configuration, driving experience, etc., which marks a new pattern of brand development towards high-end, and once again proves its leading position and core competitiveness in the micro-electric vehicle industry.
During the Jinzhai conference, Hongxida officially announced the national idol Cai Guoqing as the brand image spokesperson. Hongxida is based on the high-end micro-electric industry, focusing on high-end micro-electric products, providing the audience with a safe, environmentally-friendly and efficient way to travel, and guarding every micro-trip in all directions. Cai Guoqing conveys warmth and blessings to the public with a very friendly image and familiar works, which are highly compatible with the concept of accompanying consumers to pursue a happy life. In the future, the two sides will work together to write a new brand story of "making happy travel at your fingertips".

Multi-level market layout, strengthening new cognition of high-end brands
Enterprise development can not be separated from publicity and promotion, and so can good products. Over the years, Hongxida has summed up a set of methodology in market layout, that is, vertical extension and horizontal ecological expansion.
In terms of vertical extension, Hongxida incites the minds of target audiences and potential users from multiple angles by sponsoring variety shows, creating new media live IP and other forms that consumers like, and promotes the rapid landing of brand awareness. The core purpose of expanding brand awareness and affinity is achieved while increasing brand image display channels and narrowing the distance with consumers.
In addition, Hongxida also launched the "Knife Camp Plan" dedicated to building 100 strong channels. Set up special funds to support dealers to open specialty stores in the core business district, renew and upgrade stores, and densely lay advertisements around stores. For channel providers, getting brand financial support and strategic guidance can reduce their operating pressure, increase their operating confidence, and then more actively expand the market and serve customers.

From consumers to dealers, an era March of precision and high-end service has been played.
In terms of horizontal expansion, Hongxida went to the 21st China (Jinan) New Energy Electric Tricycle Exhibition non-stop after the Jinzhai Industry Summit, and participated in the exhibition with the "Six Flagship Micro-cars Matrix". At the exhibition, Hongxida had an in-depth exchange with merchants from all over the world to discuss the development trend and cooperation opportunities of micro electric vehicles. With this platform, Hongxida demonstrated its product advantages and technical strength, actively sought opportunities for cooperation with all parties, and laid a solid foundation for future market expansion.

Under the linkage of Jinzhai Summit and Jinan Exhibition, Hongxida has attracted wide attention from all walks of life. During the period, many dealers all over the country have established cooperation with Hongxida, which shows the high recognition of product quality in the whole industry and also represents the brand’s next step in the journey of realizing high-end and advanced.
At the same time, Hongxida also appeared at the 45th Bangkok International Auto Show in Thailand. At the auto show, Hongxida attracted the attention of many exhibitors and media reporters. Its unique design concept, advanced configuration and excellent driving experience give consumers all over the world a brand-new perception of China Zhizao. Relying on this auto show, Hongxida’s popularity and influence in the international market have been further enhanced, providing strong support for the next global development layout.

From Jinzhai, Anhui Province to Jinan, Shandong Province, and then to Bangkok, Thailand, a picture of high-end and globalization of domestic micro-electric vehicle brands is slowly unfolding.
Hongxida’s combination boxing of "one meeting and two exhibitions" is an important strategic layout for the brand to March towards high-end. At this stage, consumer behavior tends to be rational and pragmatic, more and more users pay more attention to the high-end quality and high-quality price ratio of products when purchasing, and the trust and preference of the younger generation of consumers for domestic products have become an inexhaustible driving force for the domestic micro-electric automobile industry to be stable and far-reaching. It is reasonable to believe that in the near future, Hongxida will join hands with more consumers with innovative technology, high-end products and quality services to create a new era of smarter travel. Let’s look forward to the new era of high-end micro-electric vehicles led by Hongxida to bring more surprises and changes to our lives.